The Browser is your friend
Modern browsers have come a long way since Netscape Navigator, along with performance, and usability has come significant leaps in development quality of life.
The Console
The console offers a powerful tool to debug and manage JavaScript execution in the browser.
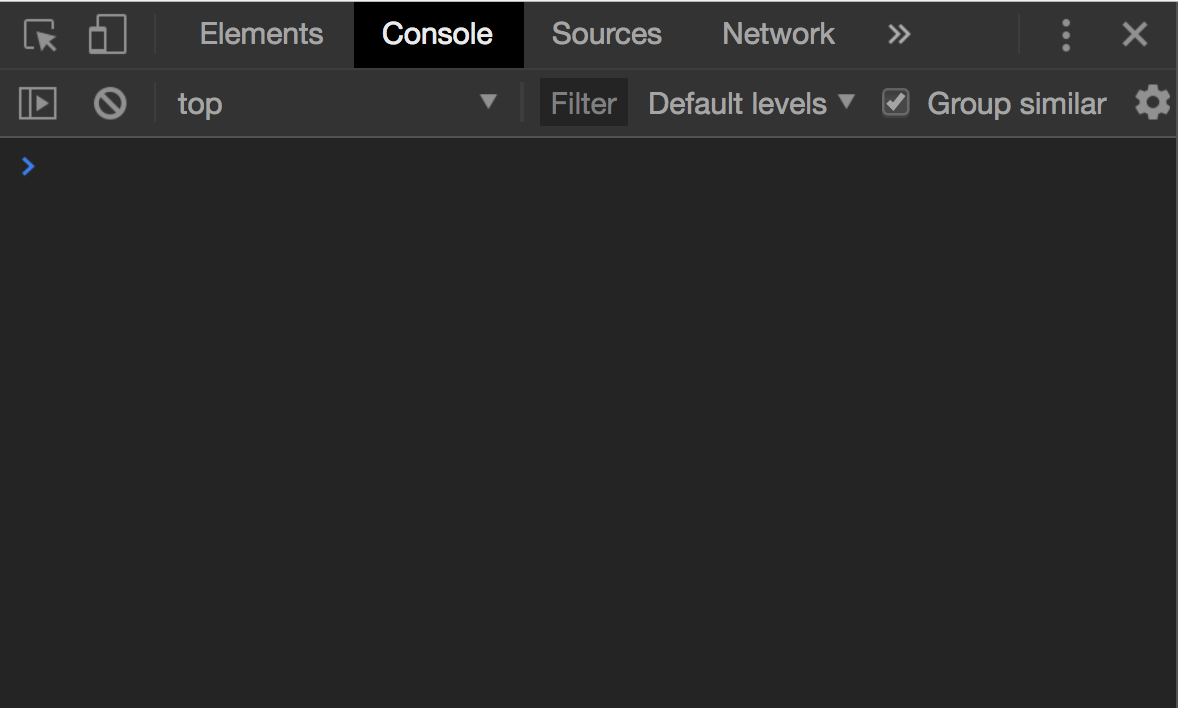
On most browsers, you can access console output, by opening
browser devtools. It’ll look something like this on Chrome.
For the most basic type of debugging, you can use:
console.log('some debug string...');
.. In your JavaScript code to figure out what’s being executed, when and where. This is akin to print debugging, but the console is considerably more powerful.
But we can also write directly into the browser’s console, to get live output on our frontend’s states.
Try typing window for example, in the console, and
you’ll see the console spit out the window object.
In fact, anything that is reachable from the global state can be inspected, live, within the console.
DevTools
To really harness this power we can go a step further, and add breakpoints to our code and then live inspect application state, at a designated timeslice.
All of these may seem like overkill, but debugging JavaScript can often be quite difficult; remember, JavaScript is dynamically typed, and asynchronous. Print debugging can be unreliable and confusing.
Getting familiar with the browser debugger will save you future unnecessary headaches.